Signal Maps
Signal Maps
NEON Signal Mapper solution was developed for personnel that need to geo-reference signal or sensor data indoors and in other areas where GPS is unavailable. With automated 3D tracking based upon inertial sensors, NEON Signal Mapper reduces the time and cost to map and report on collected data. The Signal Mapper app connects to a Spectrum Analyzer and automatically georeferences the data. The data is saved in a Signal Map file, which can be opened and viewed in NEON Command.
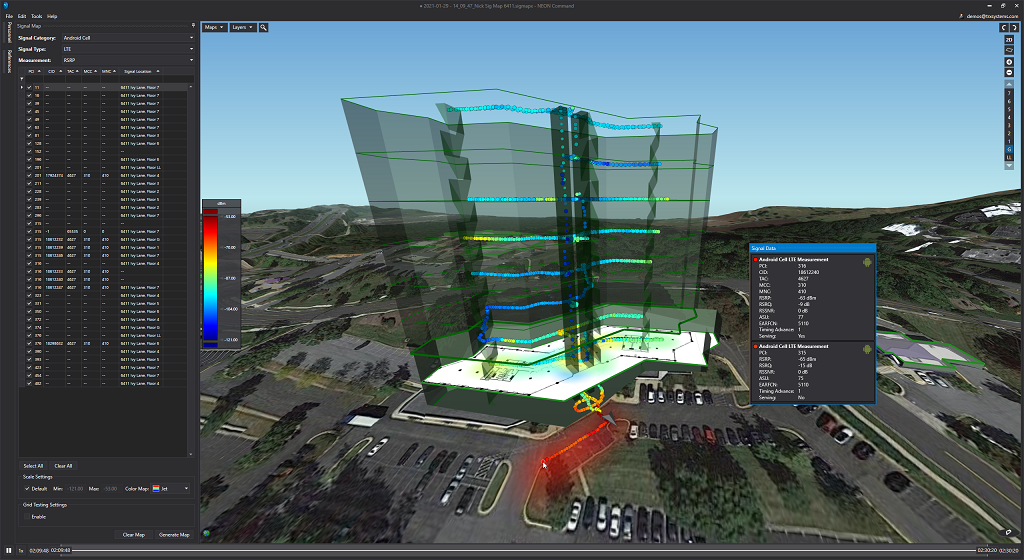
Signal Maps are a way to visualize the data collected by RF engineers using the NEON Signal Mapper app. Signal Maps contain all of the data collected during the mapping session and this includes BLE, Wi-Fi, LTE from the Android device, and data from the connected spectrum analyzer. Signals are selected and a Heatmap is generated to show the intensity of various signal strengths and the path where the data was collected. The data can then be exported in various formats. The image below shows a heat map of Android Cell data. The red coloring shows a strong RSRP value, about -63 dBm. The blue coloring indoors shows lower signal strength, an RSRP of about -102 dBm. Each dot can be clicked on to get a detailed readout of all the information.
Open Signal Map
Signal Maps can be opened from a locally stored .sigmap or .sigmapx file or from the NEON Cloud. In order for a signal map to be available on the cloud, it must be uploaded from NEON Signal Mapper. See the Signal Mapper documentation for more information on saving signal maps.
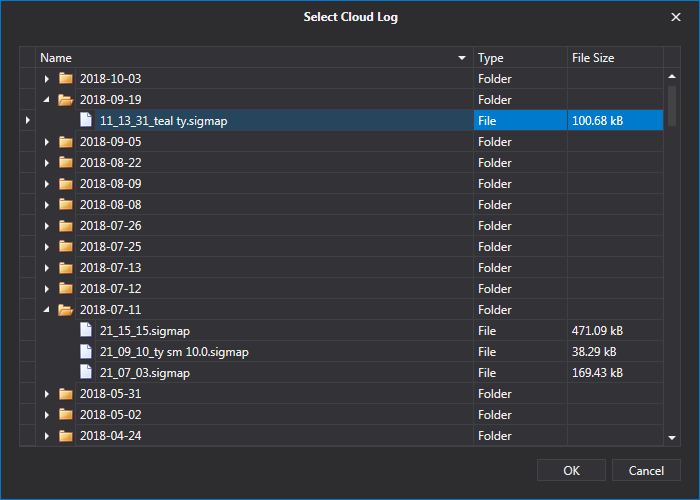
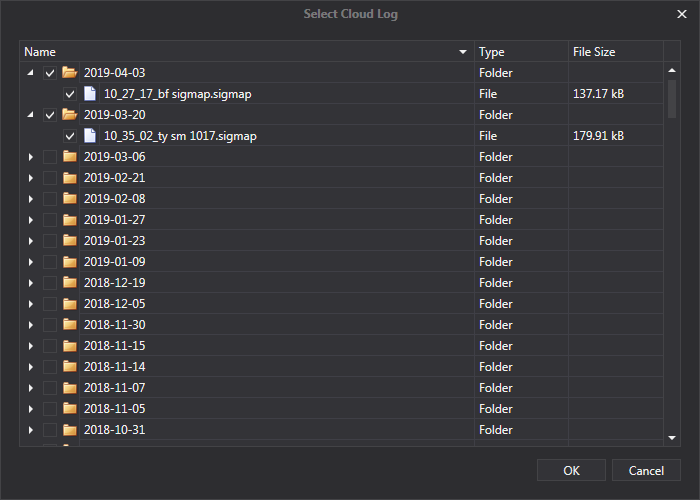
To open a signal map on the cloud, click “File > Open > Cloud Signal Map”. Folders are named with the date of the signal maps and the files are named with the time they were uploaded as well as the name they were given at that time. Double click a file to open it, or select it and click “Open”.
To open a signal map stored locally, click “File > Open > File”, or press “Ctrl+O”. Select the appropriate file in its saved location and then click “Open”.
Signal Map Sidebar
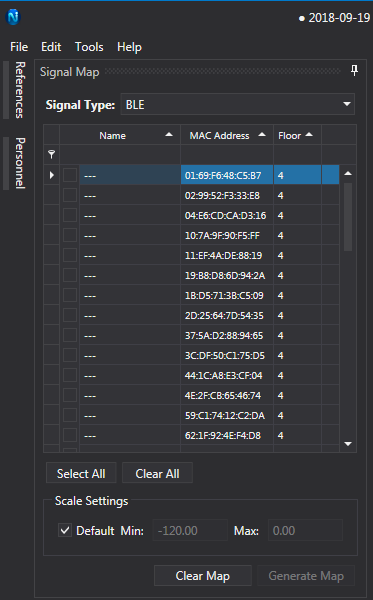
The Signal Map sidebar shows all signals and signal types that were measured in the signal map. The signals that will be listed will only be of the type selected. To select a new signal type, click the dropdown menu at the top of the sidebar.
Filter and Select
The signal filter allows users to search through all measured signals. Users can filter signals by typing the filter criteria just below the signal property name. Each signal type will display a different set of properties. The list below shows the properties that can be filtered and sorted for each signal type.
- BLE - Name, MAC Address, Floor
- WiFi [2.4GHz and 5.0GHz] - SSID, BSSID, Channel, Floor
- GSM - Cell ID, Floor
- CDMA - Base station ID, Network ID, System ID, Floor
- WCDMA - PSC, Floor
- LTE - Cell ID, Floor
- DAQ - Floor
- Channel Scanner (Anritsu) - Channel, Center, Span, BW, RLevel, Floor
- SPA (Anritsu) - Measurement, Mode, Frequency, Direction, Floor
- Viavi (Viavi) - Name, Mode, Direction, Floor
- Tektronix (Tektronix) - Name, Floor
On the left of the sidebar, click the checkboxes to select signals. Click the “Select All” button beneath the signals list to select all of the signals in the current filter. Click the “Clear All” button to clear all checked signals.
Generate Heatmap
With at least one signal check, click the “Generate Map” button at the bottom right of the sidebar to generate a heatmap of the selected signals. Click “Clear Map” to remove the heatmap.
After generating a heatmap, the color map will automatically scale to fit the measured values. This can be disabled by unchecking the “Default” check box in the “Scale Settings” section of the sidebar. With the Default setting unchecked, change the values for “Min and Max” to set bounds on the color map. After changing these values, click “Generate Map” to view the updated colors.
Heatmap
Heatmaps are a cumulative display of signal measurements in an area. They will display the color of the strongest signal along a given segment of a user’s path. The heatmaps can be exported in various formats for distribution.
Users can configure heatmaps in a few ways: smoothing radius, opacity, and aggregation method. These can all be configured in the signal mapper preferences. The smoothing radius sets the display area for a particular signal measurement. Reduce the radius for more measurements to be shown in the heatmap. By default, the opacity is set to 50% at the measurement location. Heatmap opacity decreases further from the measurement location. The aggregation method determines if the heatmap is generated from the maximum, minimum, or average signal measurements.
Signal Readings
Each data point is represented as a color dot. The color of the dot corresponds with the signal strength at that location and the selected color map. The Color Map scale is displayed on the left side of NEON Command. The highest and lowest values in the Signal Map set the min and max on the scale. The scale can be manually adjusted in the Scale Settings section of the Signal Map sidebar. The default Color Map is Viridis which ranges from yellow (strongest signal) to purple (weakest signal). Gray dots are displayed when the user has walked in an area, but there is no signal detected. Each data point can be clicked on to view all of the signal information at that location.
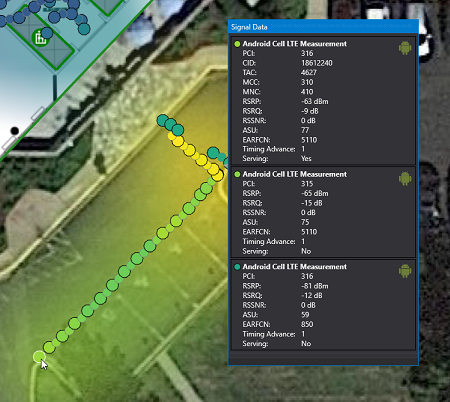
By default, the color dots are displayed with interpolation. Interpolation is used to fill in the gaps between signal readings so there is a uniform and continuous line trailing the test engineer’s path. Interpolation can be disabled in Layers > Signal Mapper > Interpolated Readings towards the top left of the NEON Command visualizer. Interpolated dots appear smaller and have a gray border, while actual readings are displayed as slightly larger dots with a black outline. The position of the Color Dots can be adjusted in 2D in NEON Command using the Path Adjust Tool.
Note: The path adjuster tool can only move color dots in 2D. Color dots can not be moved from one floor to another. The best practice is to check-in on each floor to lock the color dots to that floor.
Dual Signal View
The Dual Signal View Mode provides the capability to view any two signals simultaneously. For example, complementing signals provided by the spectrum analyzer such as RSSI and BER can be displayed to provide a more complete view of the signal coverage. Dual Signal View Mode can be enabled in “Edit > Preferences > Signal Mapper > Dual Signal View”. When enabled, the signal sidebar will split into two sections, “Signal 1” and “Signal 2”. The signal type, measurement, and individual signals can be selected for each. The scale and color map can also be selected for each.
In the example below, LTE and WiFi 5G signals are displayed. WI-FI displayed as the circle using the “Jet” color map, and LTE is displayed as a square using the “Viridis” color map. The color corresponds to the received signal strength value at that location.
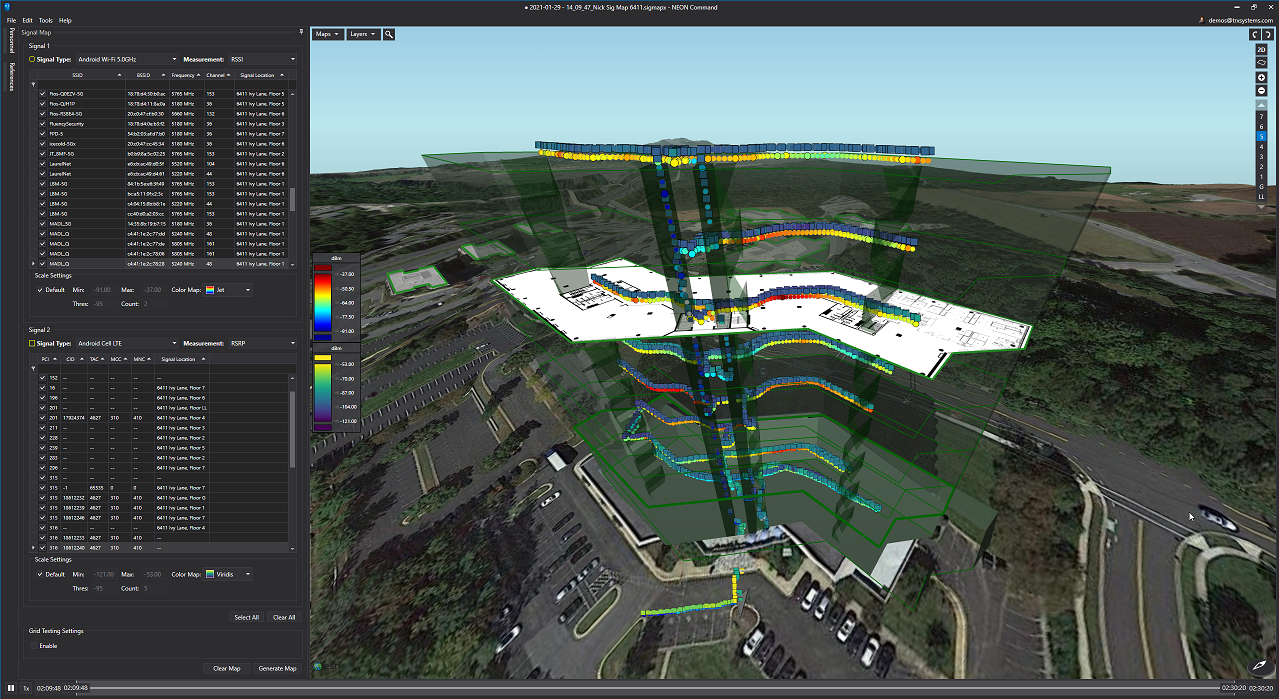
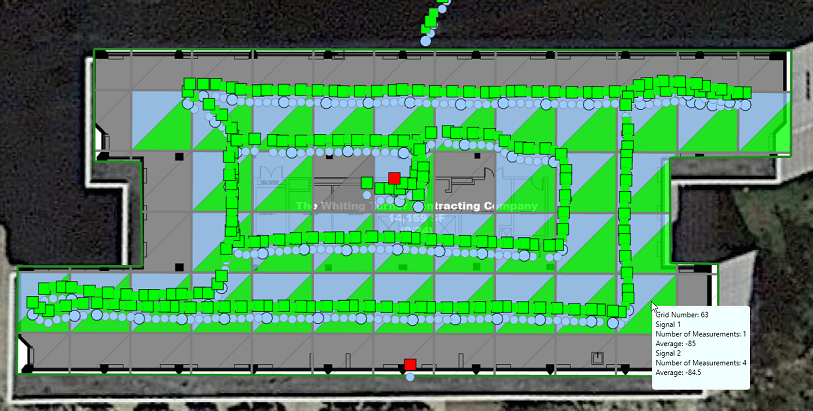
The Dual Signal View is extended with the automatic grid testing feature and the automatic reporting feature. Each grid is divided into two to easily viewable halves to see where each signal fails.
Note: The best practice is to set two different color maps to easily distinguish between the signals.
Color Map
Heatmaps and colored dots will be displayed using the color map that the user has selected. Color maps can be changed by clicking “Edit > Color Maps”, then select the appropriate color map from the list, click “Set Default”, then click “Save”. See the documentation on custom color maps for more information.
Path
Signal Maps also display where users walked at any given time. Use the time bar at the bottom to control the time frame of a user’s path. This is covered in more detail in the track viewing documentation.
Export
Once a heatmap has been generated, it can be exported into various formats. These exports typically consist of a .zip file which includes .csv files and images that can be viewed without NEON Command. Complete documentation on this subject can be found in the report generation document.
Combine
Multiple signal maps can be combined into a single file in order to be viewed at the same time. Signal maps can be combined regardless of their time or location. While viewing the combined signal map, each combined file will appear simultaneously as its own avatar. Users can combine signal maps that are stored locally and on the cloud.
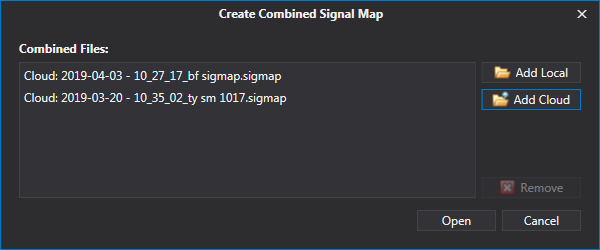
To combine signal maps, click “File > Open > Combined Signal Maps”. This will open a window that will show all of the signal maps being combined. To add local files, click the “Add Local” button and select the appropriate files from the computer. To add signal maps from the cloud, click “Add Cloud” and then check the box next to the appropriate signal maps.
Once all of the signal maps have been added click “Open”. After a little bit of processing, the signal maps will open as a single file. This combined signal map can be used the same way as a standard single signal map.
Grid Testing
Grid testing allows users to check if a building complies with NFPA building testing recommendations. With grid testing enabled, the floor plan will be overlaid with grids sized per the NFPA recommendation. The grids are colored green if they pass, red if they fail, gray if there are not enough signal readings, and transparent if the grid has never been visited.
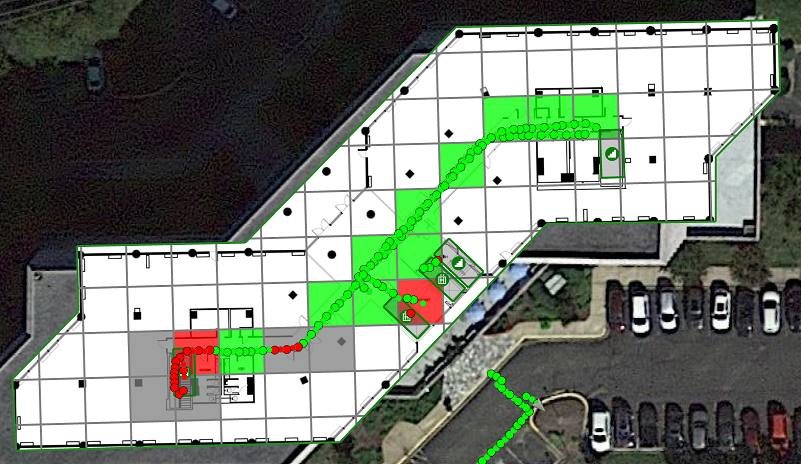
To enable grid testing enable it in the Grid Testing Settings at the bottom of the Signal Map sidebar. With grid testing enabled, a grid will be overlaid building floors when viewing a signal map. When a map is generated, it will not create a heatmap, but instead, the grid squares will fill in either green, red, or gray.
To configure the grid testing edit the number of measurements, threshold, and grid size in the Grid Testing Settings.
- Pass/Fail Threshold (dBm) - Sets the minimum required signal measurement (dBm) for a grid square to pass.
- Measurements Required in Grid (dBm) - Sets the required number of signal measurements for a grid square to pass or fail.
- Pass/Fail Threshold (DAQ) - Sets the minimum required DAQ measurement for a grid square to pass.
- Measurements Required in Grid (DAQ) - Sets the required number of DAQ measurements for a grid square to pass or fail.
Read more on grid testing here.