Grid Testing
Grid Testing can be enabled while viewing any signal map to display pass/fail grids that satisfy the National Fire Protection Association (NFPA) and International Fire Code (IFC) testing requirements. Grid Testing can also be enabled in the NEON Signal Mapper Android app in order to verify grids are being adequately measured while mapping your test site.
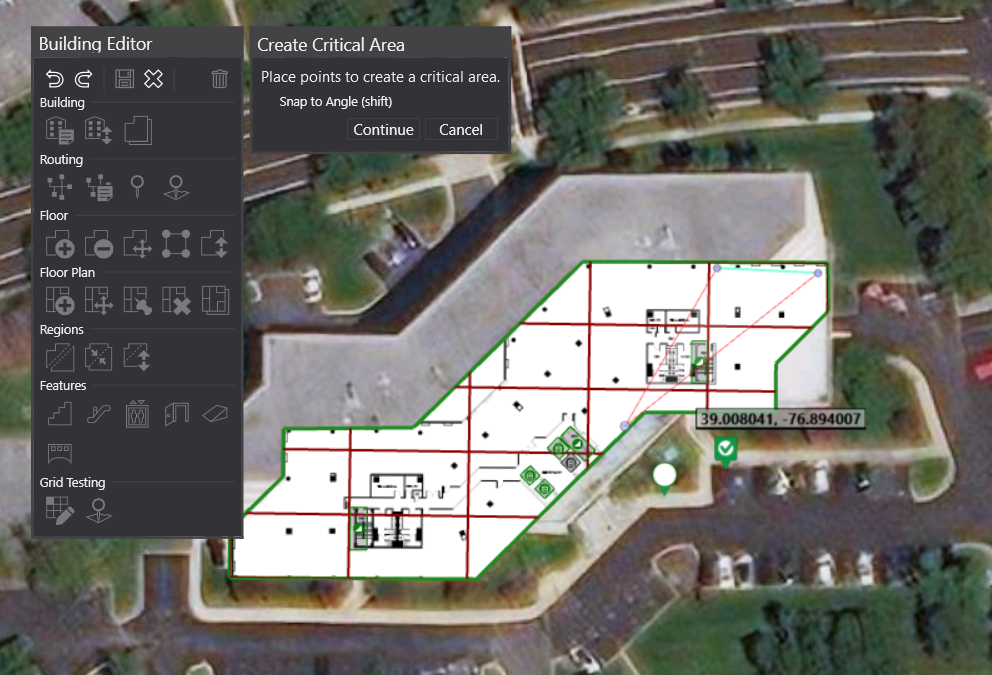
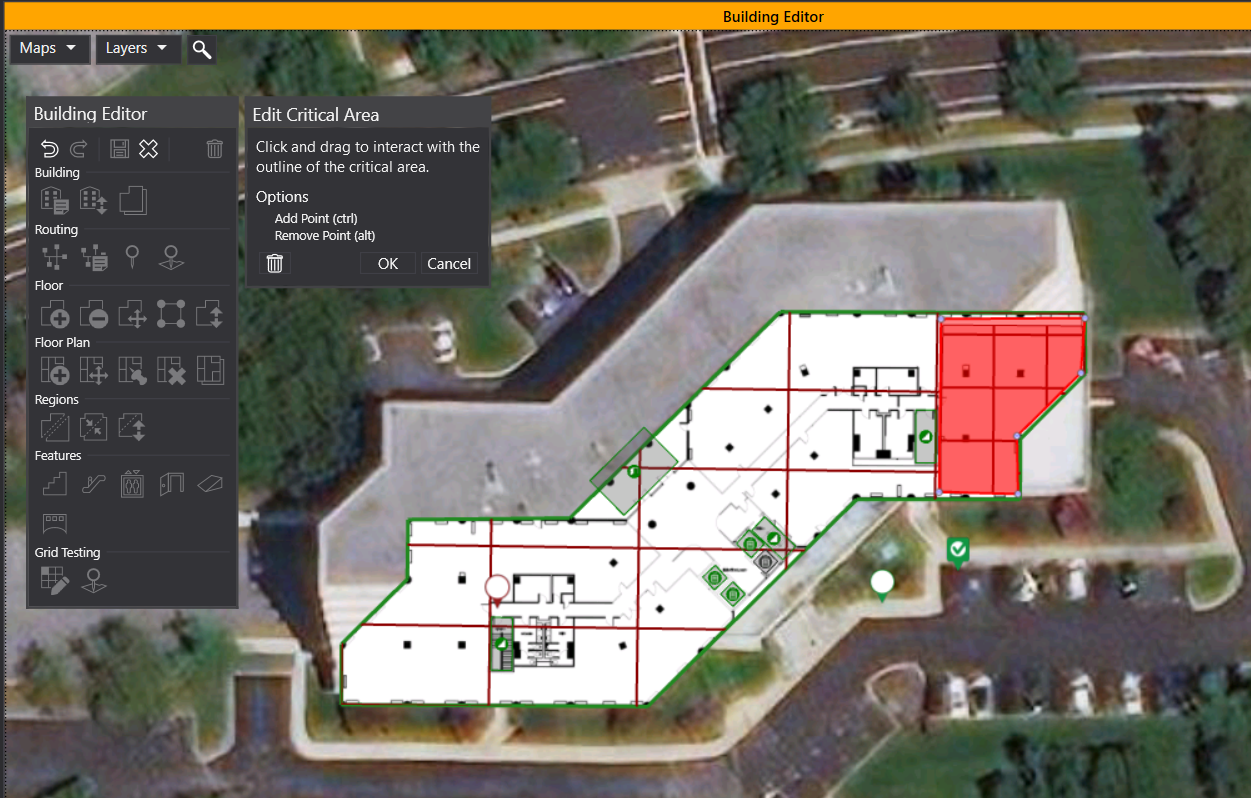
Creating Critical Area Grids
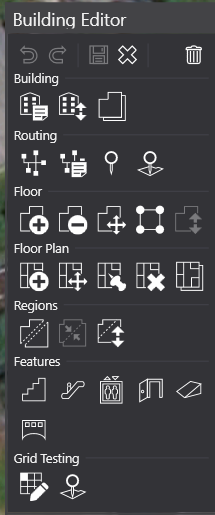
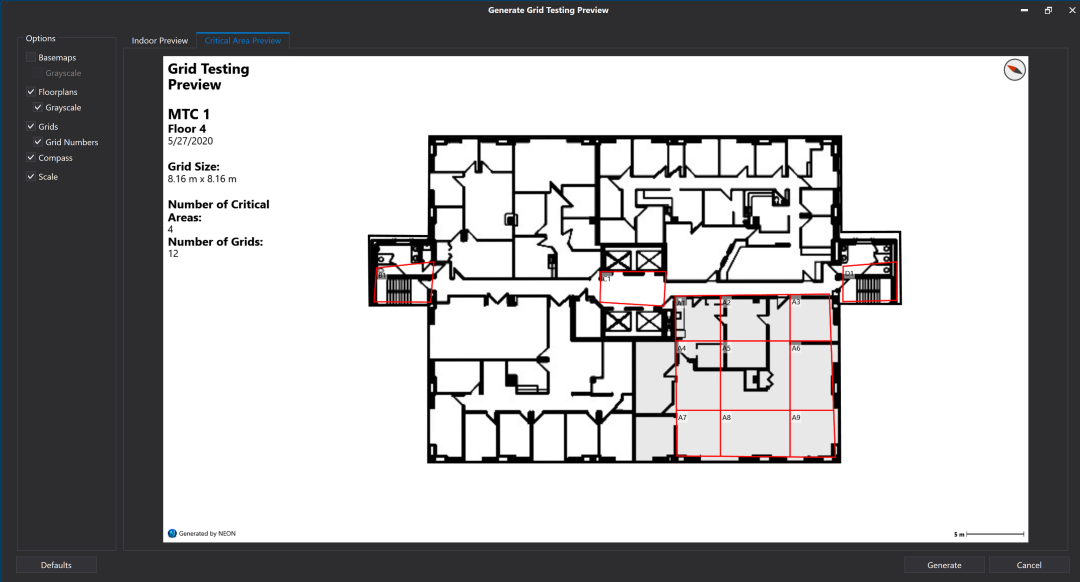
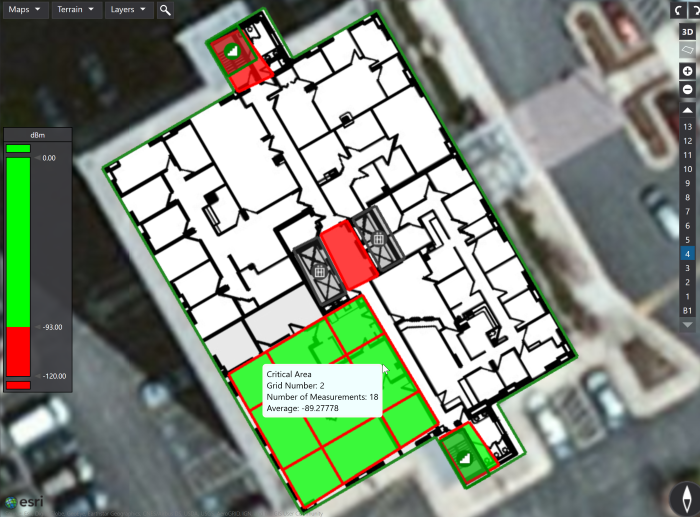
The NFPA code specifies that critical areas of a building are to have their own grid and 99% coverage is required in these areas. To add a critical area to your building, enter the building editor and click on the “Place Critical Area” under “Grid Testing.” Click at each corner to outline the critical area, then accept changes to save.

Grid Testing Preview Report
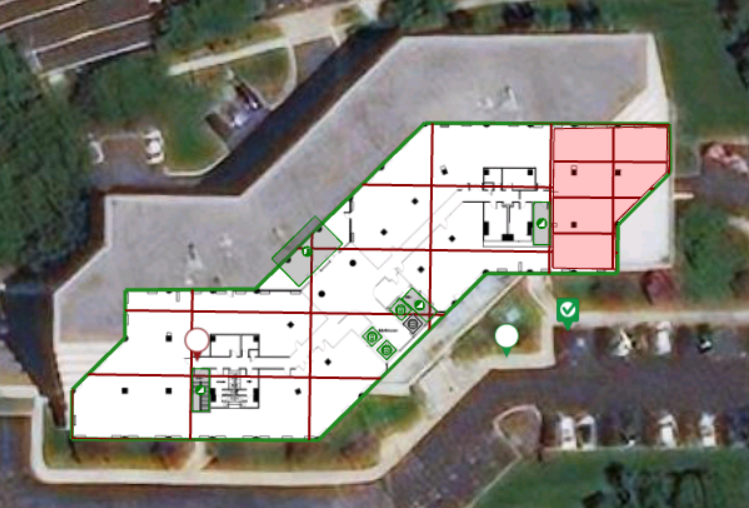
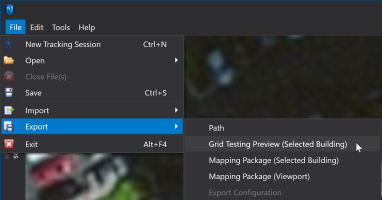
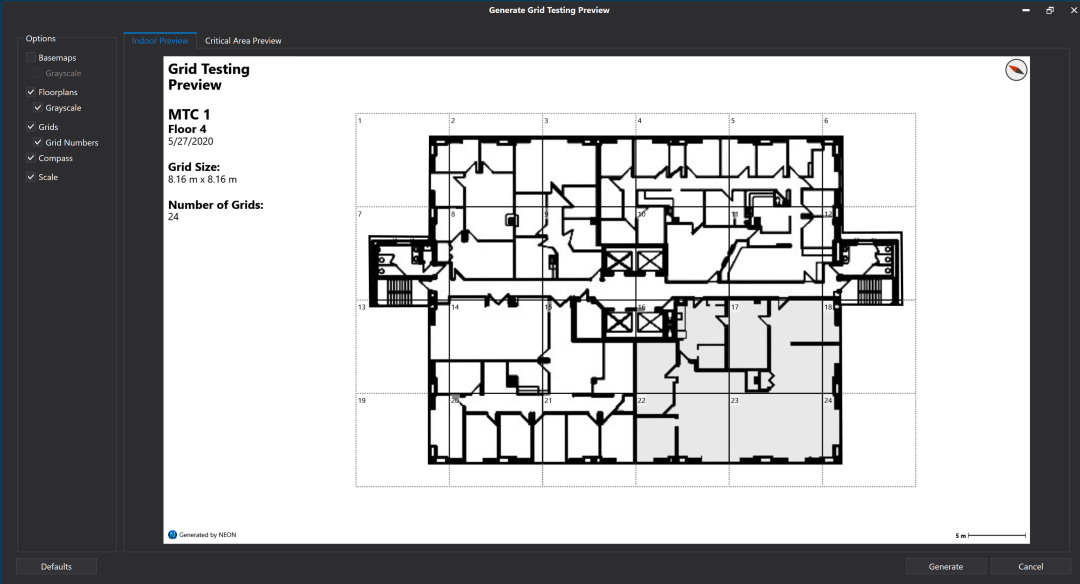
In order to view the building grids for the floors and critical areas for advance approval, you can select your building and click “File > Export > Grid Testing Preview (Selected Building).” This will generate a set of images showing the grids that will be used while on site.
Grid Testing Analysis
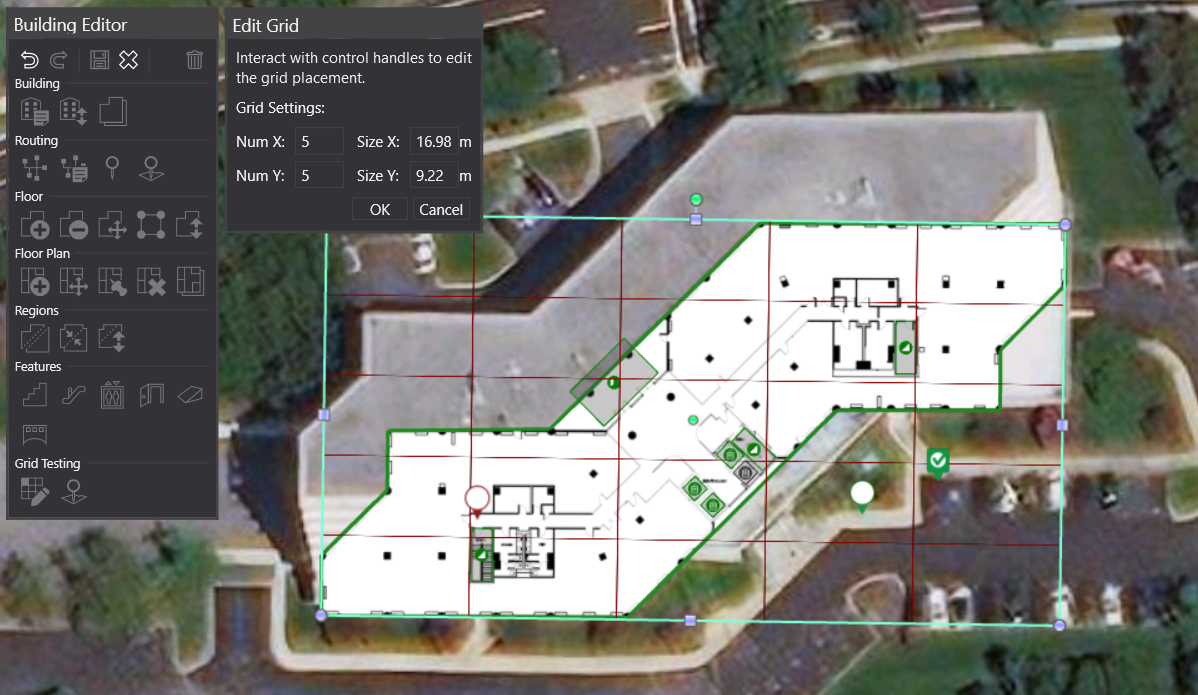
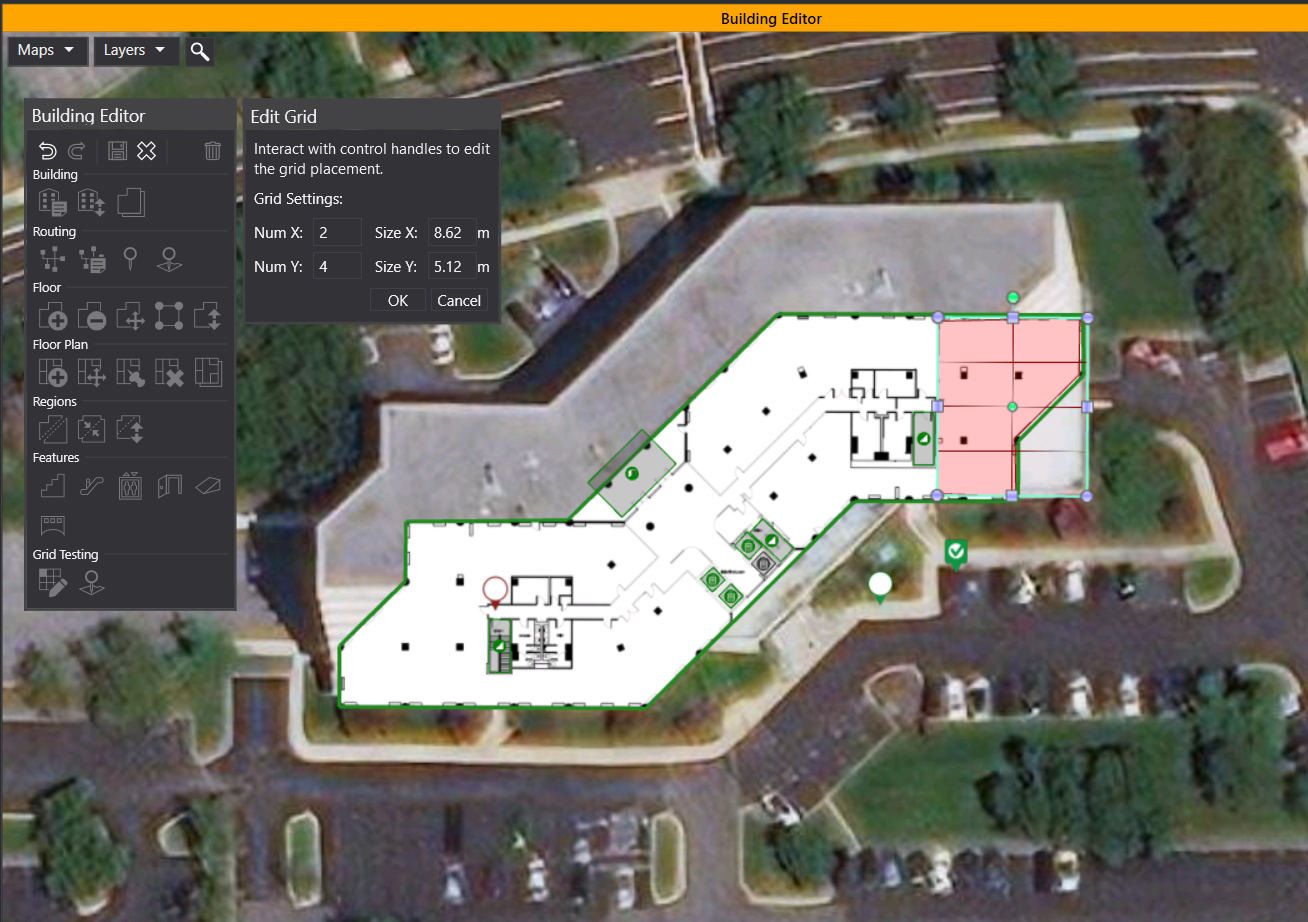
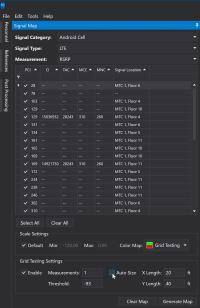
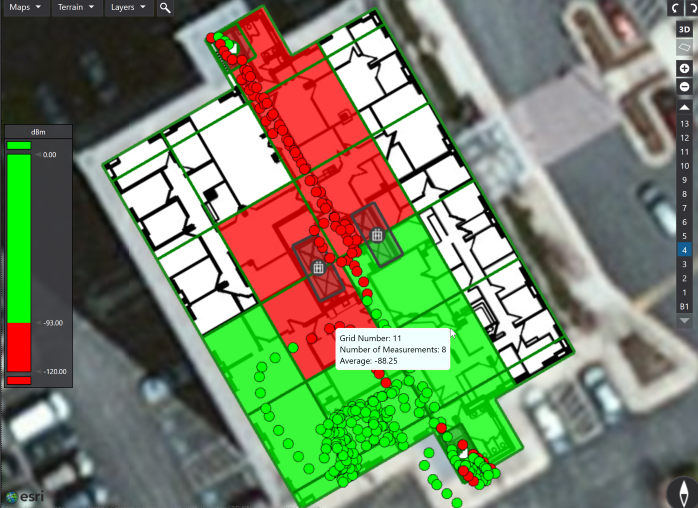
In order to view grids on NEON Command, you should first enable grid testing. On the Signal Mapper Preferences tab in “Edit > Preferences,” check the “Enable Grid Testing” box when viewing a signal map. Grid sizes are automatically computed, but if you would like to specify a standard size for the grid, you can right-click on the building and click on “Edit floor grid.” Once you save your changes, the map will display the updated grid.
You can edit the number of measurements required in each grid by opening the Signals tab and adjusting the min, max, threshold, and count values. “Change Filter” will allow you to select from the the available signals to be displayed on the map. Once you are satisfied with the look of the grids and grid settings, in the Signals sidebar, select the measurements to be displayed, then click “Generate Map.”
Grid Testing Report
After generating the map, to export a Grid Testing Report, click on “File -> Export -> Grid Testing Report”. A Grid Testing Report will include a view of the grids on each floor of the building along with statistics for each grid tile. This will include the center lat-long, the floor number, the number of measurements, the signal min/max/average, and a pass/fail/incomplete for the grid tile. There will also be a separate image and .csv file that shows the critical areas on a floor along with statistics for the grids in those critical areas.
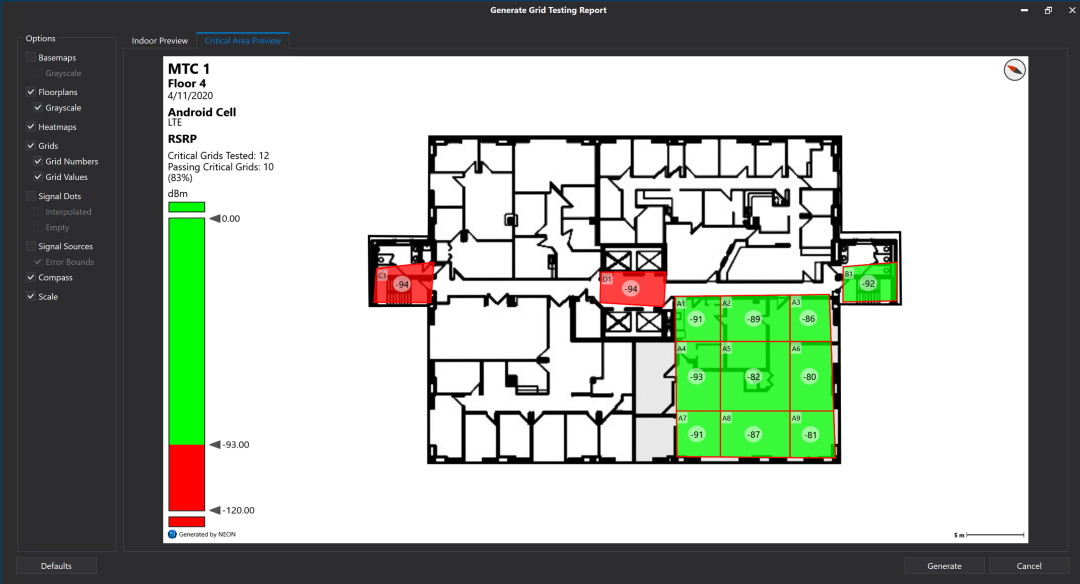
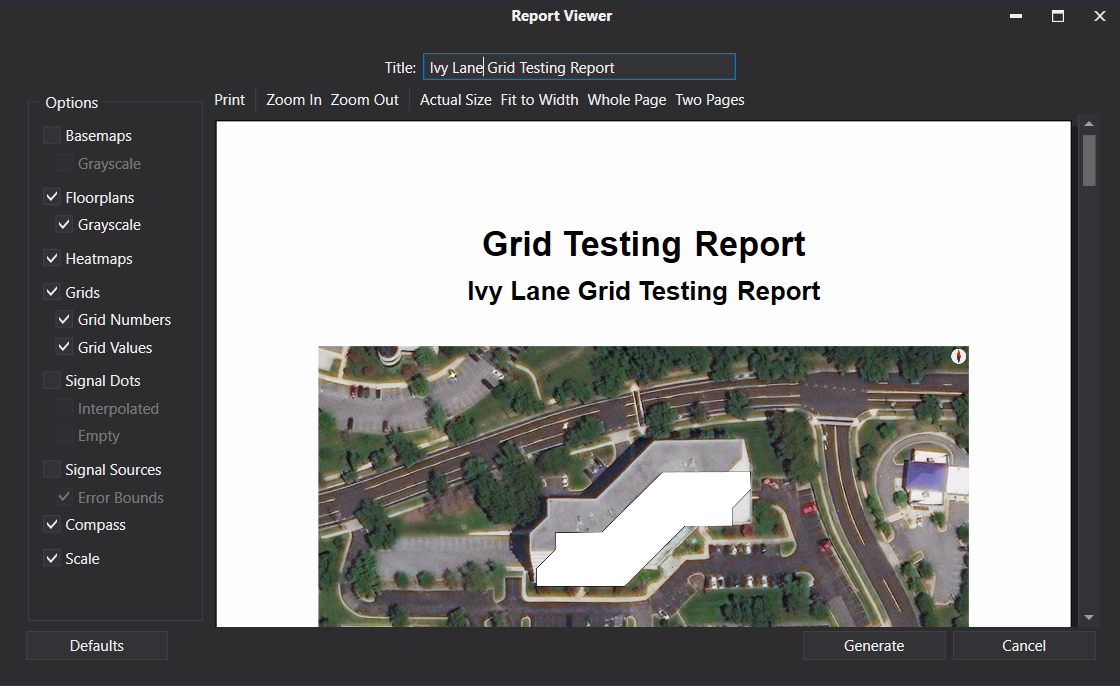
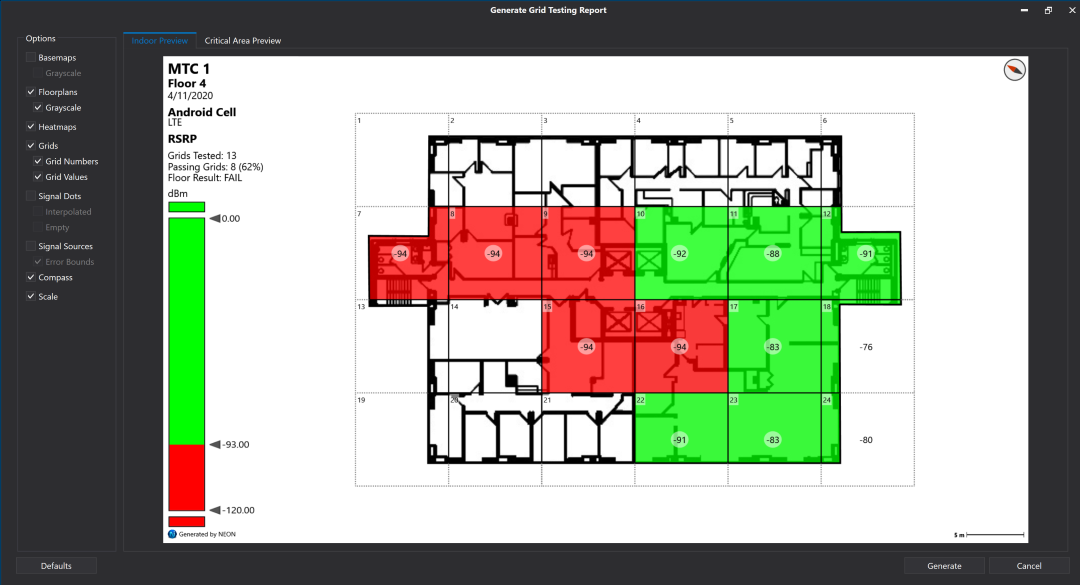
You can also export a “Grid Testing Report PDF.” This more formal report displays pass/fail data, provides an overview of the building result, floor results and information related to the measurements and threshold values per each grid.