Signal Map Reports
While viewing a signal map, users can create reports with georeferenced signal data. Most reports also include images of the signal heatmap and path. Please see the Signal Map documentation for information about generating heatmaps.
Once a signal map is open and a heatmap has been generated, a report can be created. To do this, click, “File > Export” and then select a report type to generate. The sections below will describe the contents of each report type.
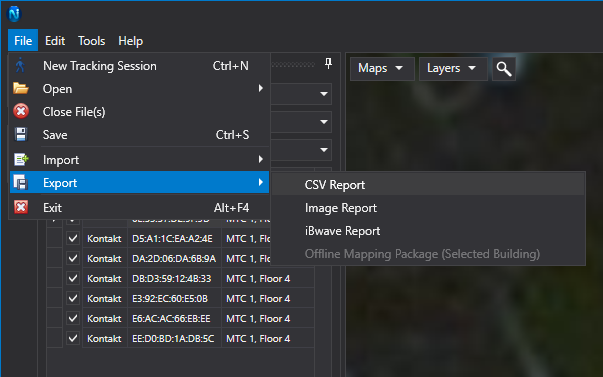
Image Report
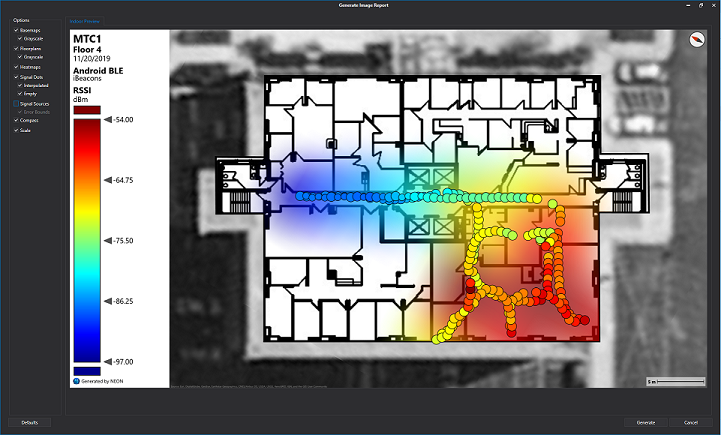
The image report is based on the floors that are covered by the selected heatmap. The report contains a folder for each building in the signal map and a subfolder for each floor. Layers of the exported images can be enabled or disabled in the preview screen. Additionally, any pictures and notes will also be included in the folder. Like the CSV report, a NEON location .csv file and a signal .csv file will be generated for each floor. The signal type selected for the heatmap will be the only included type of signal in the .csv file.
Grid Testing Report
The Grid Testing Report is an extension to the Image Report that is used when grid testing is enabled. Grid Testing can be enabled/disabled by clicking “Edit > Preferences > Signal Mapper > Enable Grid Testing” in the preferences dialog. In addition to the regular elements of an Image Report, a Grid Testing Report will also include a .csv file for each floor with information about each grid tile. This will include the center lat-long, the floor number, the number of measurements, the signal min/max/average, and a pass/fail/incomplete grade of the grid tile.
For more information, please see the Signal Map documentation.
Grid Testing Report PDF
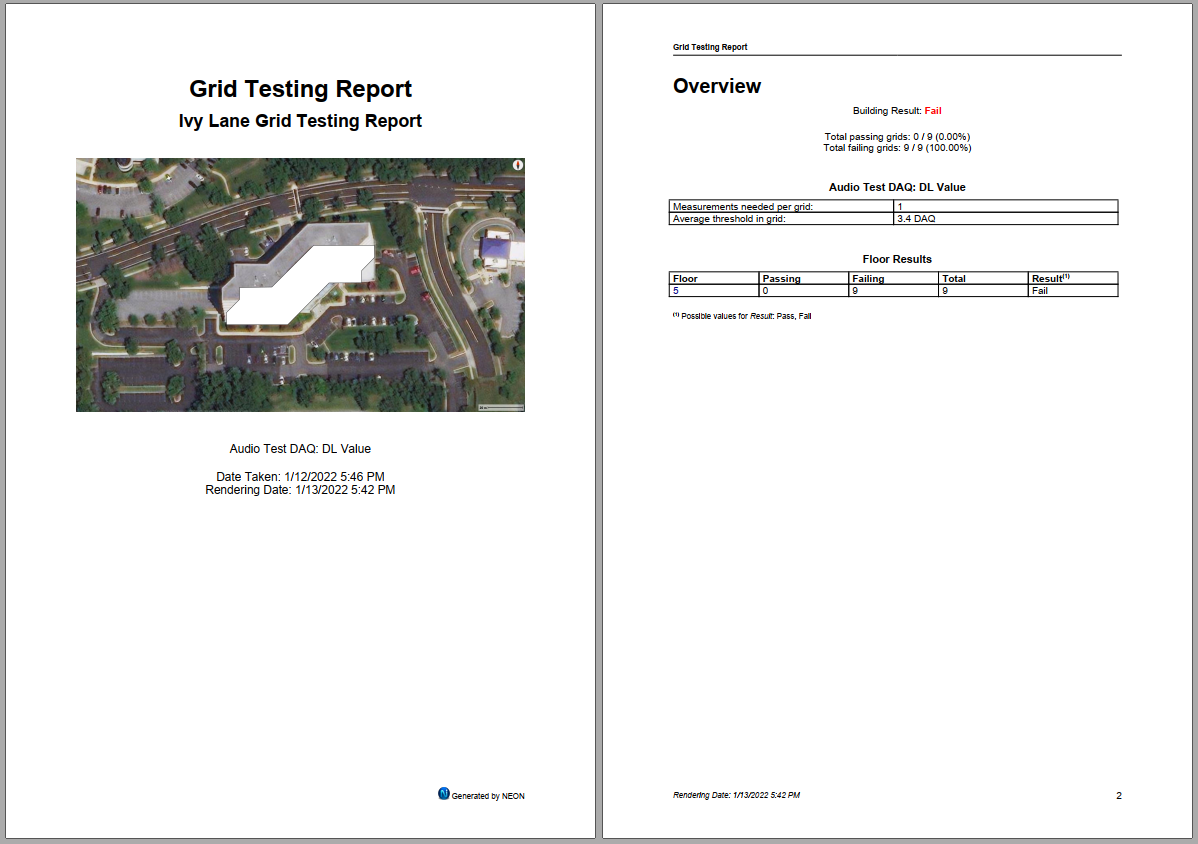
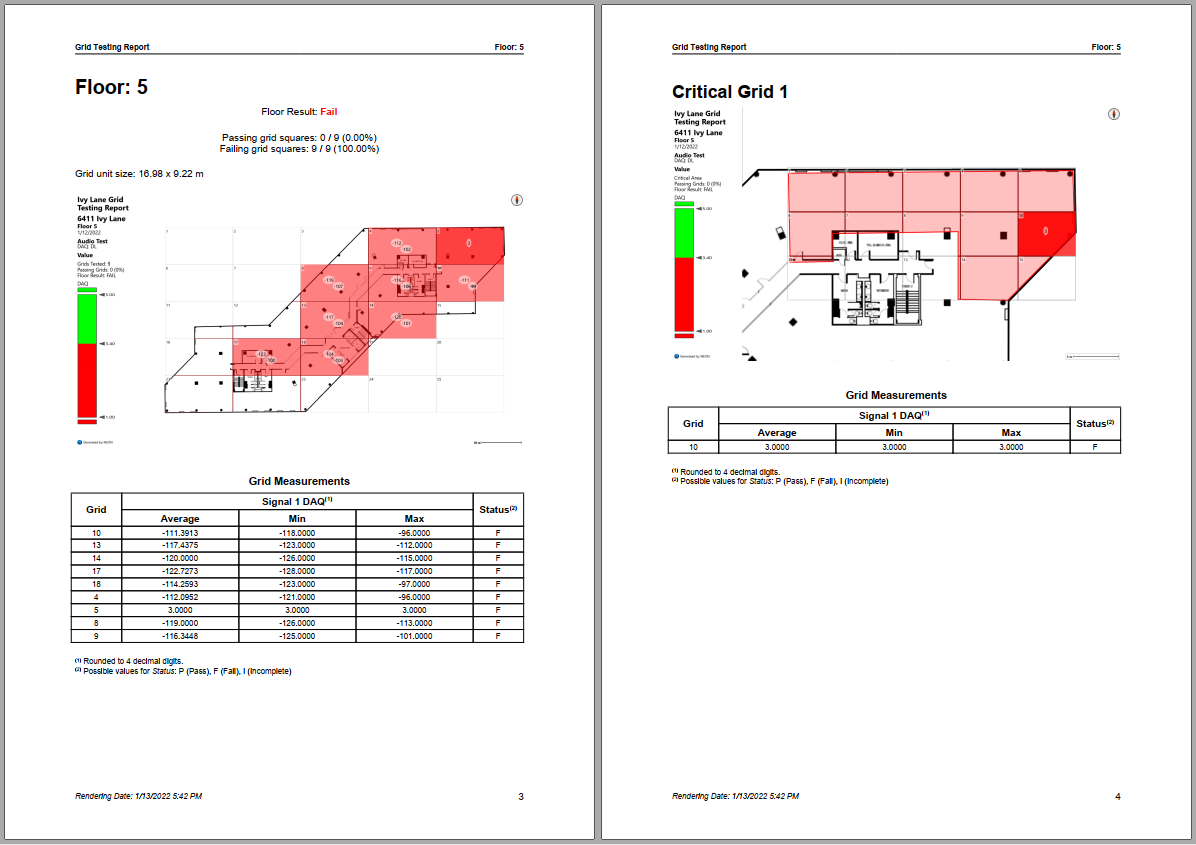
The Grid Testing Report PDF is a more formal document detailing pass/fail grid information as well as images and an overall summary of the selected building. This report is similar to the Grid Testing Report in that in addition to the floor information about each grid tile, the report also includes the number of measurements, the count and threshold values, and a pass/fail/incomplete grade of the grid tiles.
For more information, please see the Signal Map documentation.
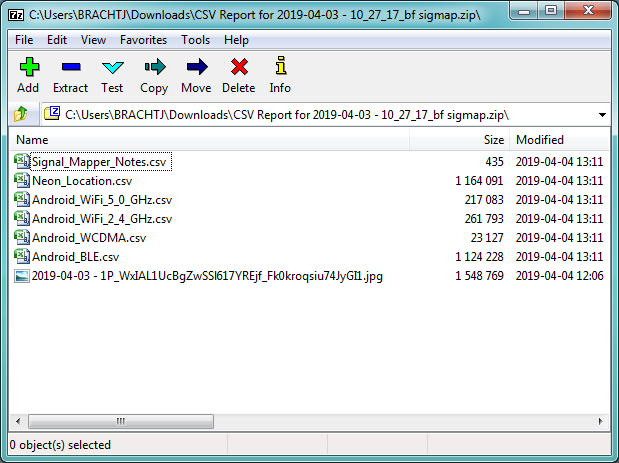
CSV Report
The CSV report creates a .zip file with multiple .csv files and any images that were taken during the log. If there are any notes or pictures in the signal map, the first .csv file will contain a list of these items with their location and timestamp. The next .csv file will be the NEON locations from the signal map. This file will contain information about each path point including: timestamp, lat-long, heading, floor, altitude, and the errors associated with the location data.
The formats for the location data are as follows:
- UnixTimeMs - Unix time with milliseconds
- Latitude - Value for the location of the user
- Longitude - Value for the location of the user
- Heading - Facing direction from North (0 deg) measured clockwise
- HeadingError - Standard deviation in degrees
- ErrorLatitude - Latitude of the center of the error bound
- ErrorLongitude - Longitude of the center of the error bound
- ErrorRadius - Radius of the uncertainty of position measured in meters
- Floor - Index of building floor. Ground floor is 0
- FloorError - Uncertainty in floor measurement in floor units
- Altitude - Meters above mean sea level (MSL)
- Altitude Error - Uncertainty of altitude measurement in meters
Each of the remaining .csv files contains the measurements for a single signal type and the location data for those measurements. The location data in these files contain the same data types as found in the “NEON Locations” file. The signal data includes all data pertaining to the file’s signal type.
This report creates files for all types measured in a signal map and therefore it is not necessary to create a heatmap before generating this report.
iBwave Report
This export method allows users to save their signal data in a format that can be used by iBwave software. Similar to the image export, this method will only include data for the signal type selected in the “Signal Map” sidebar.