Color Dots
Sensor Data
Signal data is displayed as Color Dots to show signal data that are detected as the user performs on-site data collection. The color of the dot corresponds with the signal strength at that location and the selected color map. The Color Map scale is displayed on the right side of the Signal Mapper app, and it is configurable through Measurement Options in App Settings. The default Color Map is Viridis which ranges from yellow (strongest signal) to purple (weakest signal). Gray dots are displayed when the user has walked in an area, but there is no signal detected.
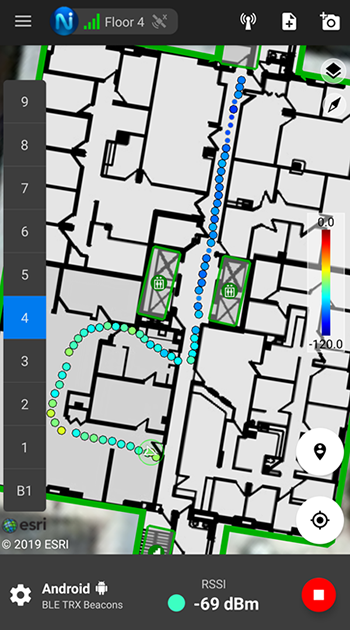
By default, the color dots are displayed with interpolation. Interpolation is used to fill in the gaps between signal readings so there is a uniform and continuous line trailing the test engineer as they walk around. Interpolation can be disabled in the Measurement Options section of App Settings. Interpolated dots appear smaller and have a gray border, while actual readings are displayed as slightly larger dots with a black outline.
It is typical for the Color Dots to move slightly as the user walks around. This is due to back propagation, where the navigation algorithms use constraint information such as check-ins to improve the accuracy of the path in the past. The position of the Color Dots can be adjusted in 2D in NEON Command using the Path Adjust Tool.
Note: The path adjuster tool can only move color dots in 2D. Color dots can not be moved from one floor to another. The best practice is to check-in on each floor to lock the color dots to that floor.
Dual Signal View
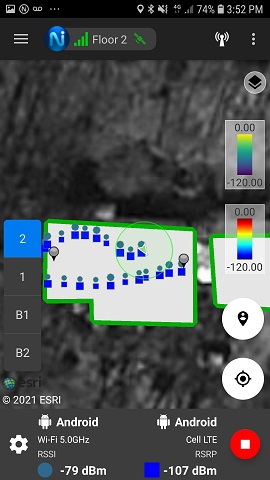
The Dual Signal View Mode provides the capability to select any two signals to view simultaneously. This can be a combination of complementing signals provided by the spectrum analyzer such as RSSI and BER, or signals provided by the Android device. In the example below, LTE and WiFi 5G signals are collected directly from the Android phone. WIFI displayed as the circle, and LTE is displayed as a square. The color corresponds to the received signal strength value at that location.
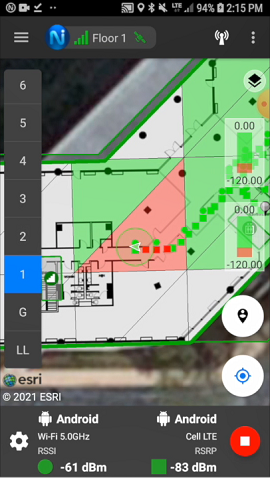
The Dual Signal View is extended with the grid testing enabled. Each grid is divided into two to easily see where each signal fails.
Note: The best practice is to set two different color maps to easily distinguish between the signals.
Dual Signal View is also supported in Remote Viewing Mode, so you can capture signal data, while a Command user is selecting the signals. In “App Settings,” selecting “Remote Viewing Mode” will allow a Command user to select two signals to be displayed on the Signal Mapper user’s device.
Note: The Command user must enable Dual Signal View in “Edit > Preferences,” selecting the Signal Mapper tab, and clicking the box to “Enable Dual Signal View.” Data between Command and the Signal Mapper applications are shared in real-time.